
The Dashboard is the first page you see after logging in to the Admin Portal. It gives you a live overview of your conversations, channels, and agents, so you can quickly see how your team is performing.
- Open the Dashboard:
- The Dashboard opens automatically after you log in.
- To return to it at any time, click Dashboard from the sidebar menu.
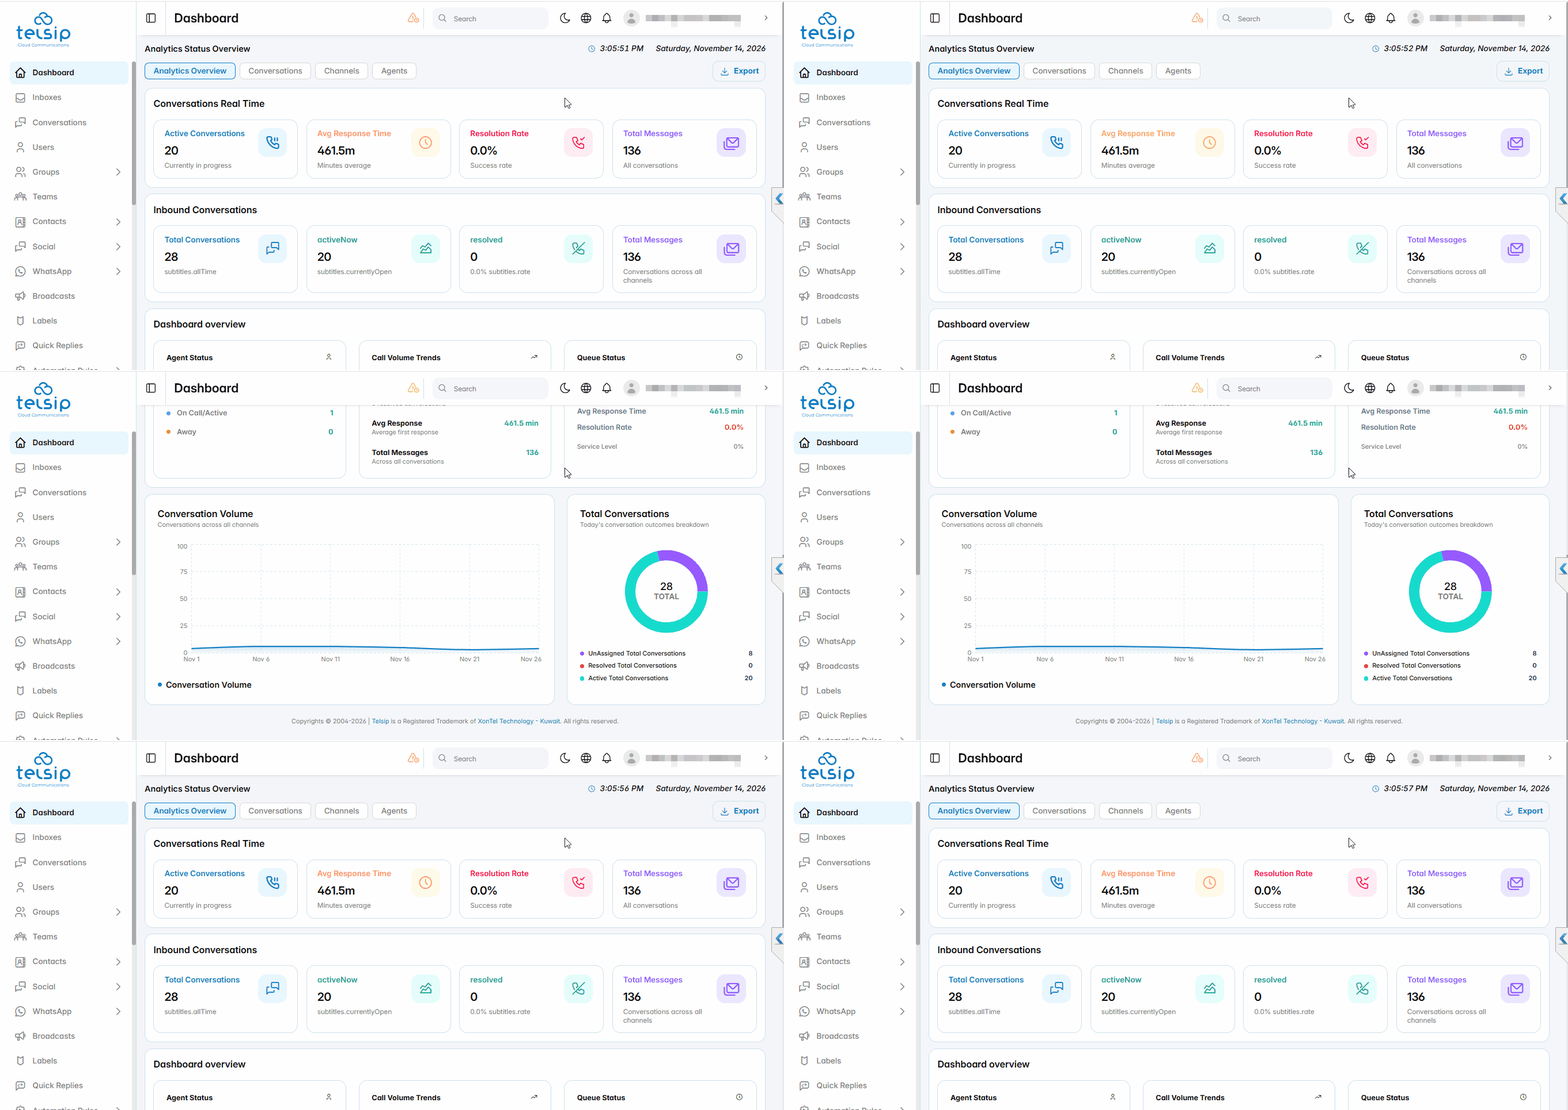
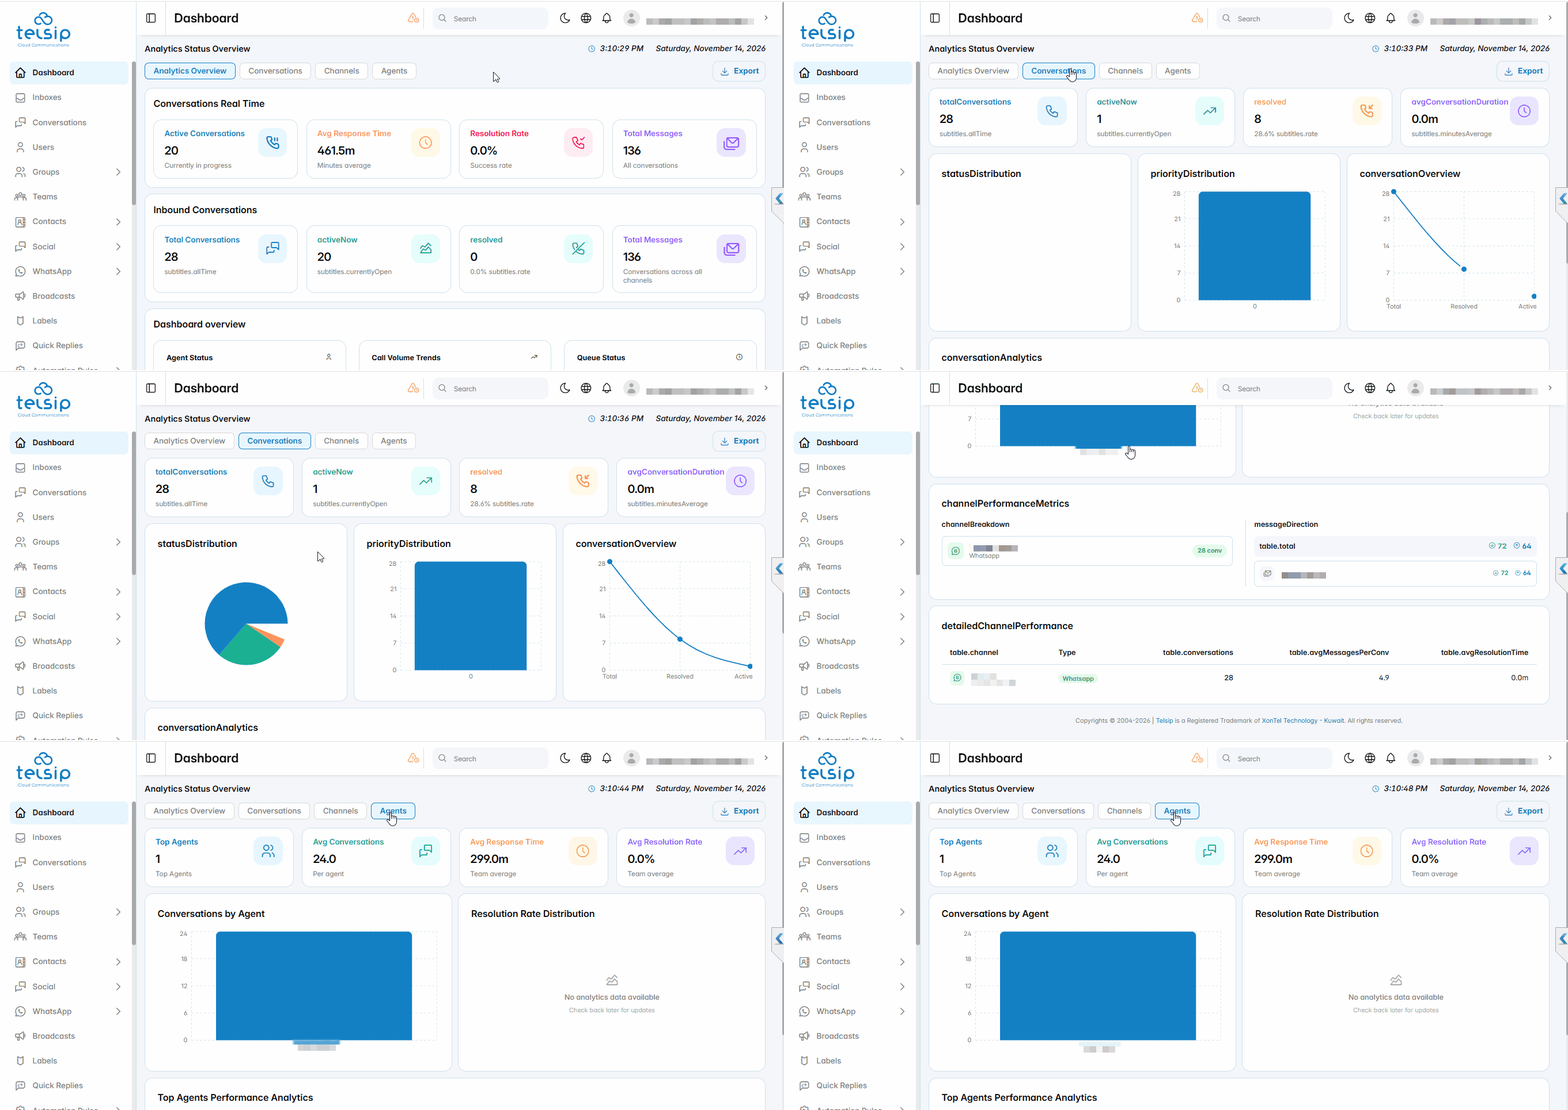
- Analytics Overview tab:
- Conversations Real Time: shows active conversations, average response time, resolution rate, and total messages.
- Inbound Conversations: shows the total number of conversations, how many are active now, and how many are resolved.
- Dashboard overview: shows agent status, call volume trends, and queue status.
- Conversation Volume: a chart of conversations across all channels over time.
- Total Conversations: a breakdown of conversations by status, including unassigned, resolved, and active.
- Conversations tab:
- Shows total, active, and resolved conversations, with status and priority distribution charts.
- Includes response metrics such as average first response time, total messages, and average messages per conversation.
- Channels tab:
- Shows the number of conversations and messages on each connected channel.
- Includes the channel breakdown, message direction (incoming and outgoing), and a detailed performance table for each channel.
- Agents tab:
- Shows top agents, average conversations per agent, average response time, and average resolution rate.
- Includes a performance table for each agent with conversations assigned, conversations resolved, average messages per conversation, and average first response time.
- Export data:
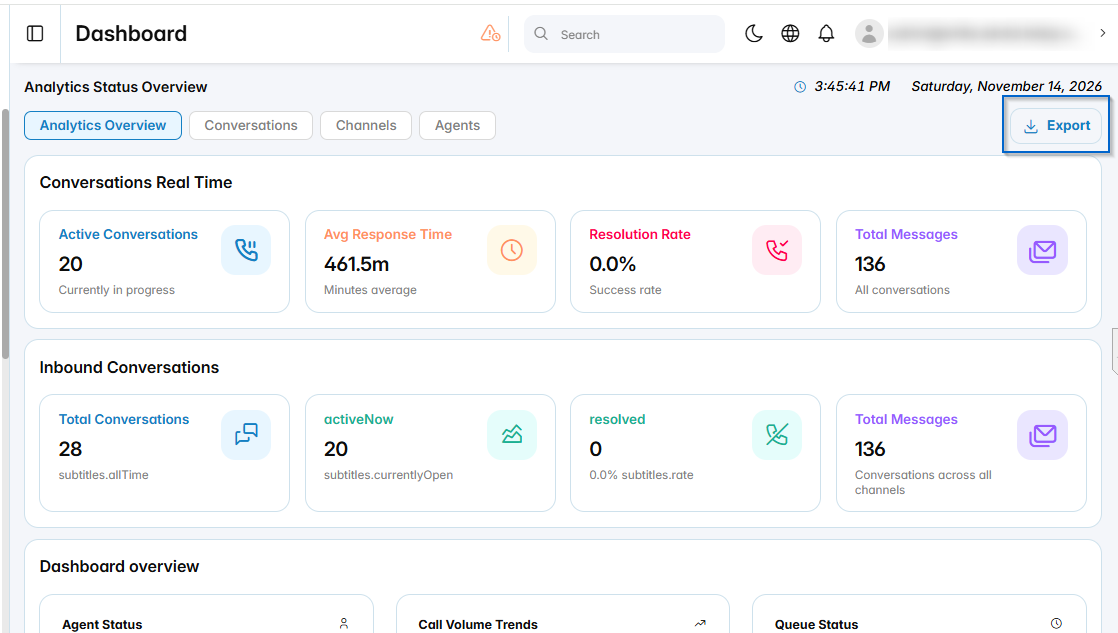
- Open the tab you want, then click Export to download its data as a CSV file.
- Export downloads the current tab only. To export another tab, open it first, then click Export again.
- Top bar:
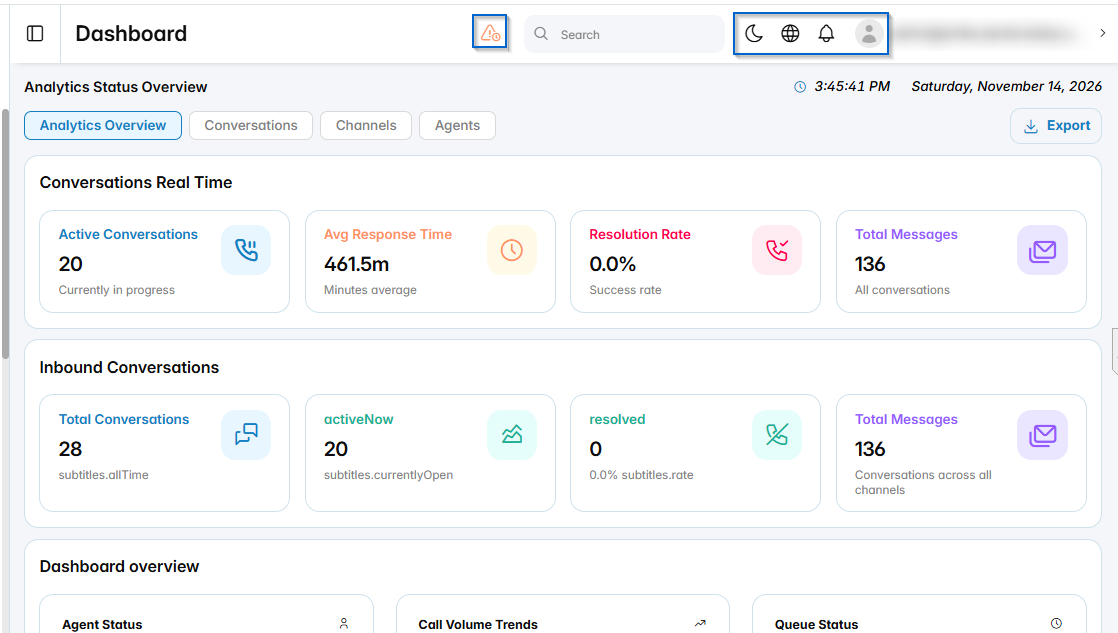
- Dark mode: click the moon icon to switch between light and dark themes.
- Language: click the globe icon, then select English or Arabic.
- Notifications: click the bell icon to view your notifications.
- Profile menu: click your profile picture to open My Profile or to log out.
- Time zone warning: a warning icon appears when your browser time zone is different from the time zone in your profile. Update your profile time zone so that dates and times are displayed correctly.
📌 Note: To view data for a specific period, such as last week or last month, use the Analytics page, where you can select a start and end date.